Quantile Vs Distribution Regression
Development
Statistics
Line goes up?
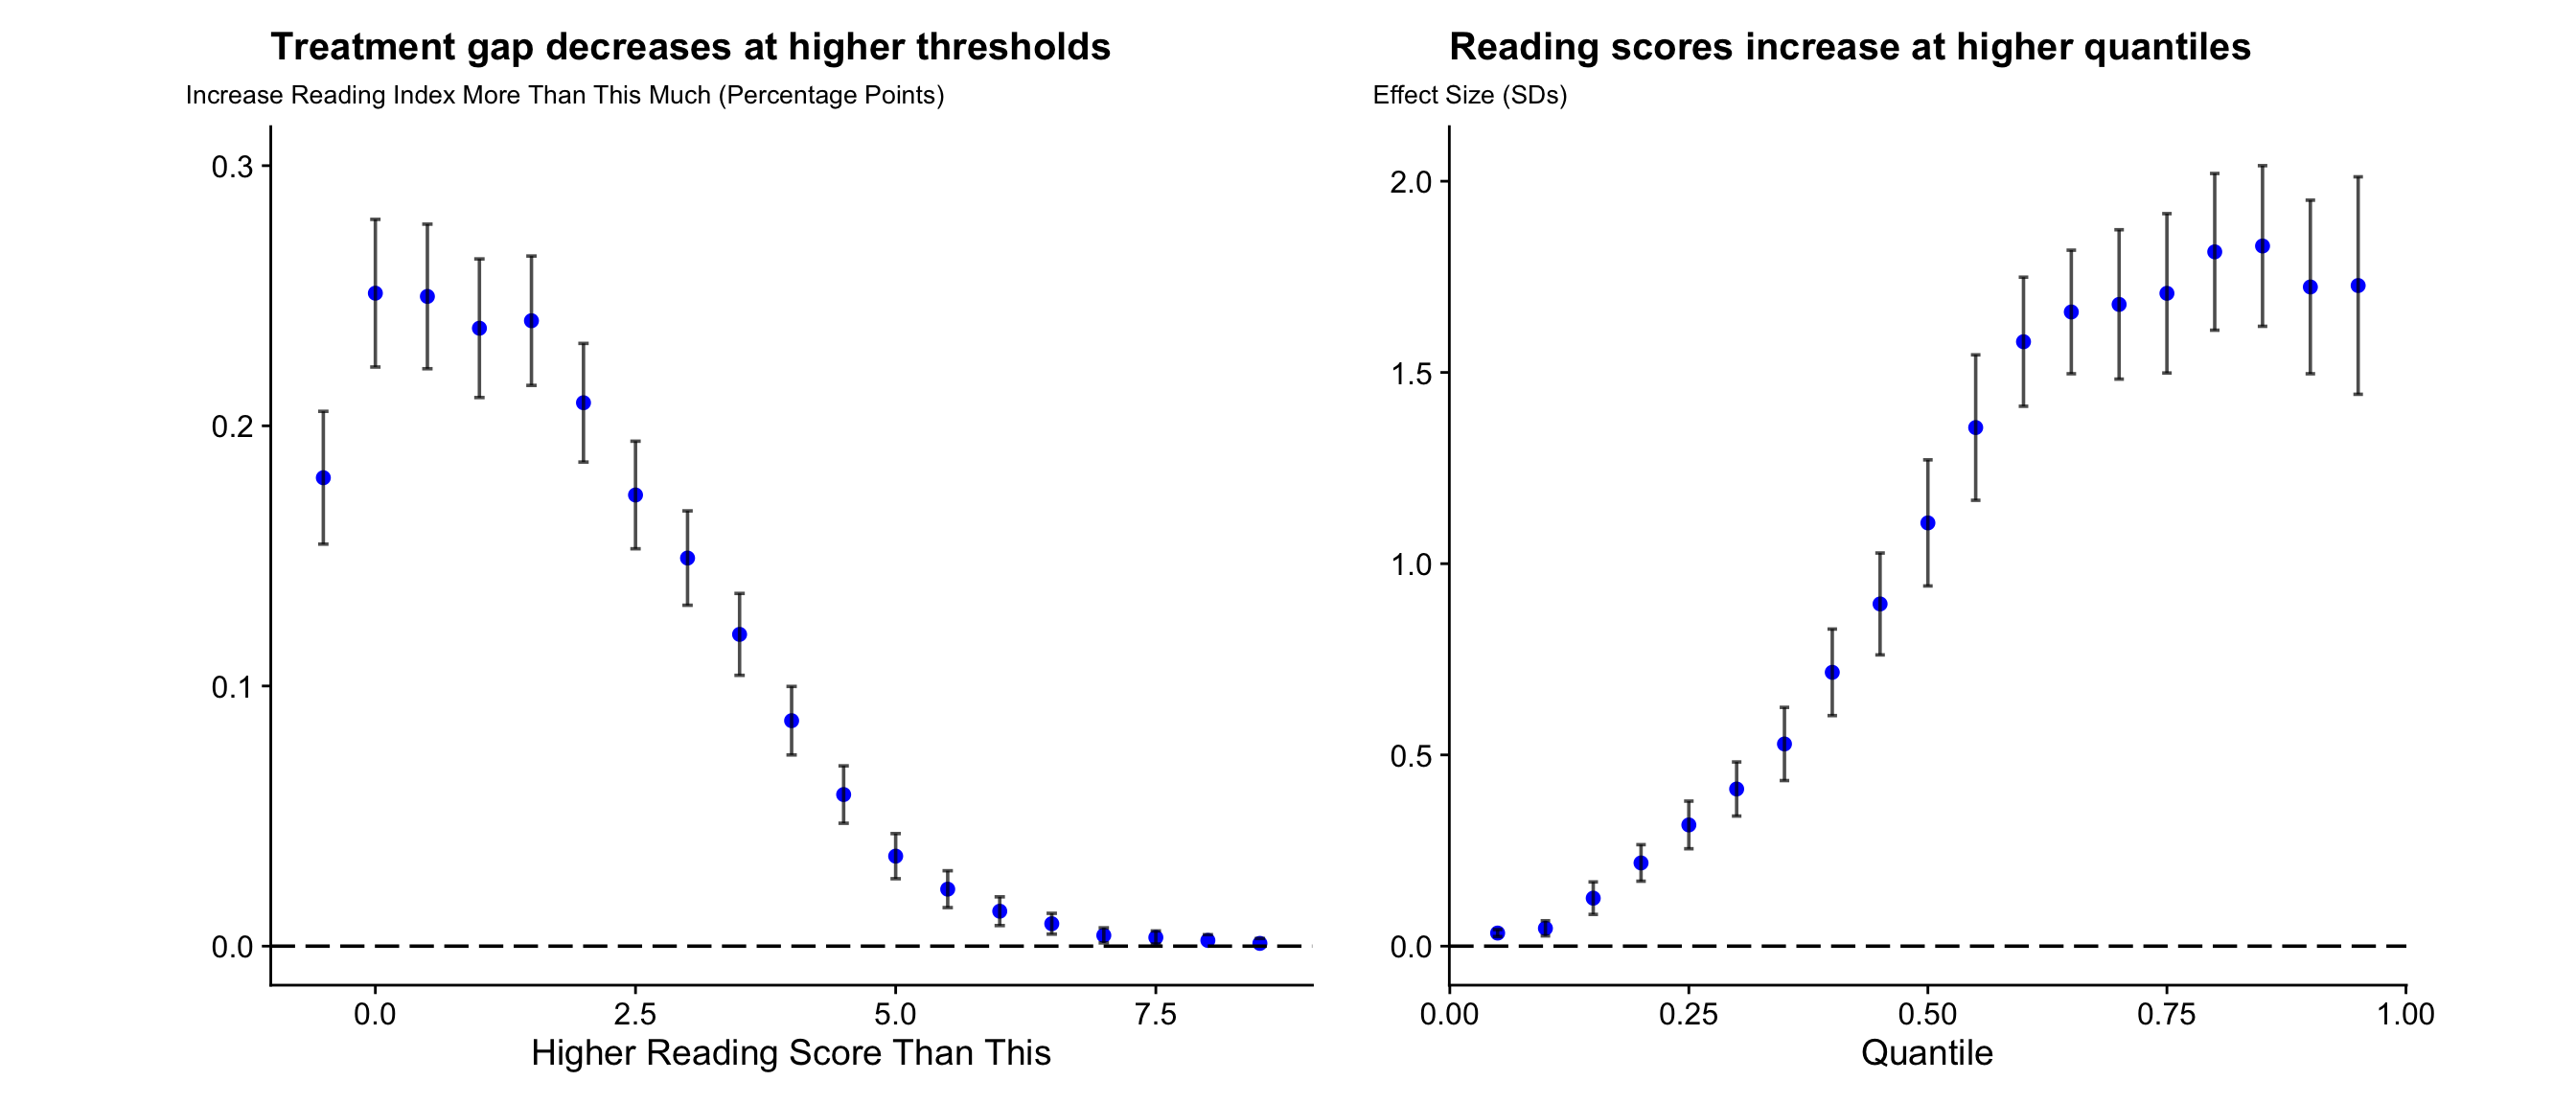
Rightly or wrongly1, most social science is concerned with average treatment effects (ATEs)2, which tell you how some policy affects the average person in a population. While learning about averages is great and challenging enough on it’s own, no one is average. It matters if a literacy program only helps students who were already steaming ahead while disregarding struggling students or if it takes students who couldn’t read at all and makes them average while doing nothing for the pre-treatment standouts even if they have the same average effect.
Luckily, hero of statistics, the humble cumulative density function (CDF) steps in and gives us several ways around it. That’s right, the humble CDF: unintuitive scourge of statistics is secretly hiding behind several commonly used estimators that people use to tell us about things other than the average person. Normally if you see a CDF, it’s best to turn and run away, but for once understanding the underlying CDF will actually help us clarify and crystallize our understanding of seemingly intuitive estimators, and explain some otherwise opaque phenomena.
In this (my first) two-part blog series, I’ll first walk you through two ways of intuitively summarizing a CDF to uncover how an intervention affects different parts of a distribution. Part two will discuss a puzzle, we’ll uncover in part one. Through it all, we’ll be using data from Kerwin and Thornton 20213 as a working example. Let’s get started.
Mango Trees
Footnotes
Definitely wrongly, but I don’t want to alienate any part of my audience within the first three words of this blog.↩︎
And “hard” science, but I would argue heterogeneity is not as big an issue in say physics.↩︎
Data citation: Munoz Morales, Juan, Jason Kerwin, Jeff Smith, Rebecca Thornton, and Julie Buhl-Wiggers. 2022. “Replication Data for SCLB.” Harvard Dataverse. https://doi.org/doi:10.7910/DVN/WUMJOJ.↩︎